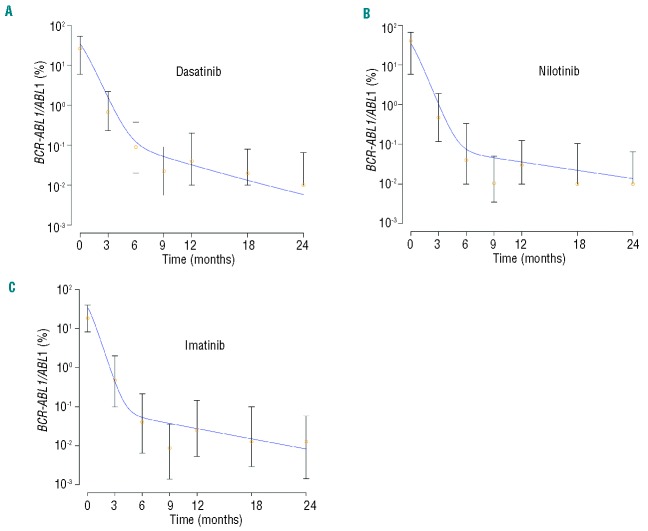
Figure 4.
A mathematical framework accurately predicts the dynamics of treatment responses of cohorts of patients treated with dasatinib, nilotinib and high-dose imatinib separately. The panels display the median (orange circles) and quartiles of the dasatinib, nilotinib and high-dose imatinib response data together with the results of the mathematical framework (blue curves, see Online Supplementary Table S1). (A) Median plots and results of the mathematical framework for the dasatinib response data. (B) Median plots and results of the mathematical framework for the nilotinib response data. (C) Median plots and results of the mathematical framework for the high-dose imatinib response data. Based on the model presented in the Online Supplement, the mathematical model prediction is given by y3/(2x3+ y3). Here x3 and y3 denote the abundance of normal and leukemic terminally differentiated cells. Parameter values are d0 = 0.0005, d3 = 1, rx = 0.008, ry = 0.01, px = 1.5×10⁻⁵, py = 1.9×10⁻⁶, ax = 0.35, bx = 5.5, cx = 100, ay = 2ax, by = 1.5*bx, cy = cx, c′y = cy, r′y = ry/15. For the dasatinib cohort, d1 = 0.0053, d2 = 0.0394, a′y = ay/200, b′y = by/300; for the nilotinib cohort d1 = 0.0028, d2 = 0.0442, a′y = ay/400, b′y = by/600; for the high-dose imatinib cohort, d1 = 0.0035, d2 = 0.055, a′y = ay/400, b′y = by/600. Apart from the dimension-less parameters, all values are given in units per day. Note that these parameter choices represent only one example that can recapitulate the dynamics of the treatment response seen in the clinic; other choices are possible.

