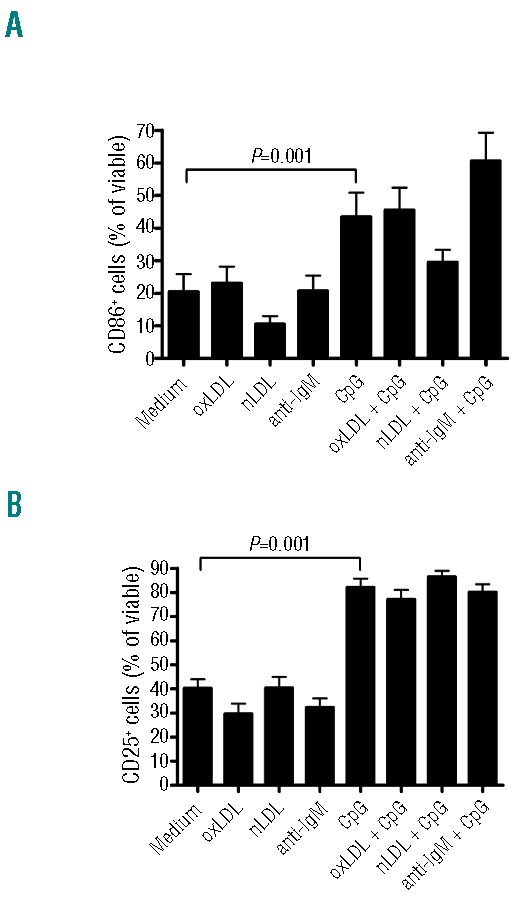
Figure 5.

Surface expression of CD25 and CD86 after BcR and TLR stimulation. CLL subset #1 cells from 5 patients were cultured in the presence or absence of oxLDL (25 μg/mL), nLDL (25 μg/mL), anti-IgM F(ab′)2 (10 μg/mL), and/or CpG (5 μg/mL) for 24 h. Surface expression of CD86 (A) and CD25 (B) was measured with flow cytometry. Only annexinV negative cells were analyzed. Data are expressed as mean ± SEM.
