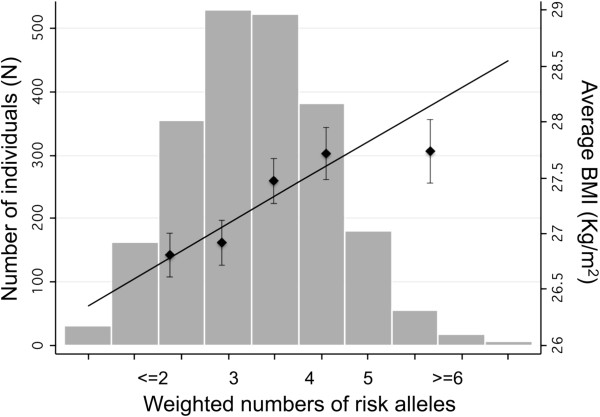
Figure 1.

Combined impact of risk alleles on average BMI in the pooled analysis. For each individual, the number of risk alleles (0,1,2) per SNP was weighted for their effect sizes and re-scaled by dividing by the average of the all the effect sizes. The weighted risk alleles for the selected SNPs were summed for each individual, and the overall individual sum was rounded to the nearest integer to represent the individual’s risk allele score. Along the x axis, individuals in each risk allele category are shown (grouped ≤2 and ≥6 at the extremes), and the mean BMI (± s.e.m.) is plotted (y axis on right), with the line representing the regression of the mean BMI values across the risk allele scores. The histogram (y axis on left) represents the number of individuals for each risk-score category.
