
Figure 2.
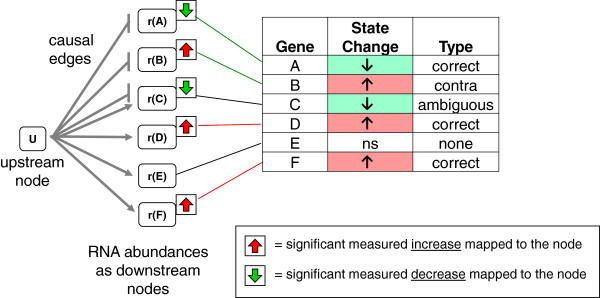
Mapping of differential measurements to a HYP network. A HYP consists of an upstream node, U, and downstream nodes, designated r(A) – r(F), that represent abundances of RNAs measured in the experiment. This example network has six measured downstream nodes (possible), five of which map to significantly increased or decreased genes (observed). Node E is not significantly changed in expression. Three nodes, r(A), r(D), and r(F), support increased U (correct). One node, r(B), supports decreased U (contra). One node, r(C), is connected to U by both causal increase and causal decrease edges (ambiguous). On the basis of the mapped measurements, the direction “increased” is assigned to U.