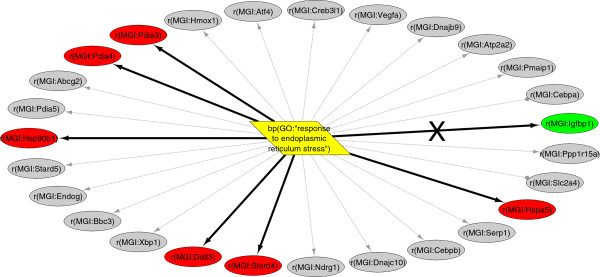
Figure 3.

Scored HYP example. The HYP with the upstream node bp(GO:“response to endoplasmic reticulum stress”), scored for the E-MEXP-1755 high fat diet data set. This network contains 27 measured RNA abundance nodes (possible), represented as ovals coloured by differential expression (red – significantly increased, green – significantly decreased, grey – no significant change). A total of seven differentially expressed RNAs mapped to the network (observed), including six supporting increased mechanism activity (correct) and one supporting decreased activity (contra, marked with an ‘X’ on the edge).
