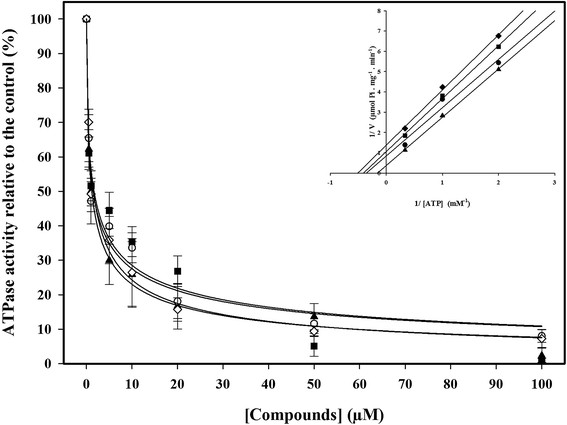
Figure 3.

Dose response curves of inhibition on Pdr5p ATPase activity by organotellurium compounds. Pdr5p-enriched plasma membranes were incubated with: (▲) compound 1; (○) compound 2; (■) compound 3; (◊) compound 5. Data represent means ± SE of three independent experiments. Inset: Double reciprocal plot of compound 1: (▲) 0 μM; (●) 0.5 μM; (■) 1.0 μM; (♦) 2.0 μM. The experiment was performed using 0.5, 1 or 3 mM ATP as a substrate. The data represent means of three independent experiments.
