
Figure 1.
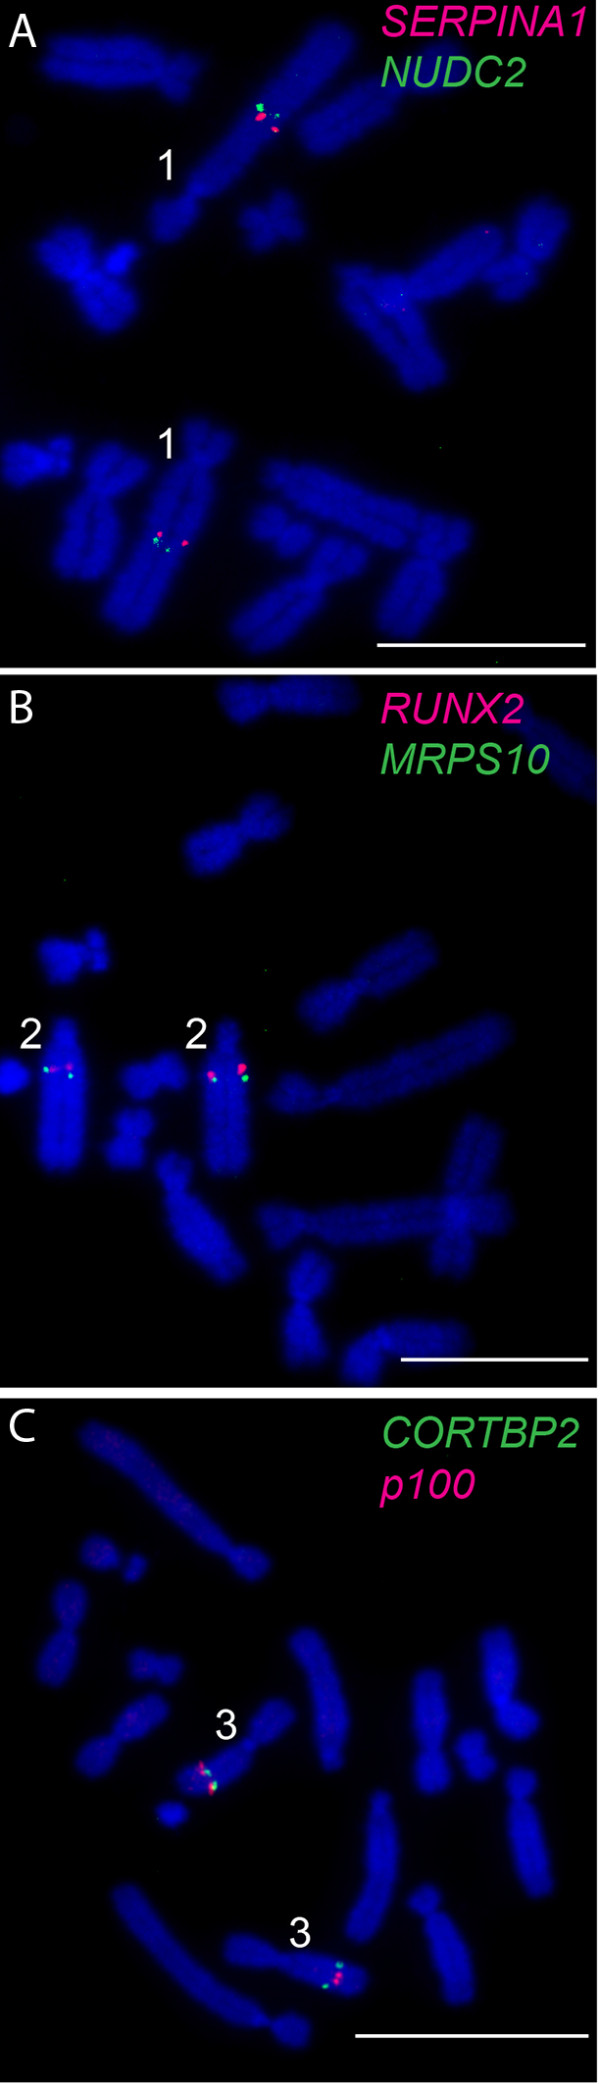
Examples of FISH determining the orientation of adjacent BAC clones on tammar wallaby metaphase chromosomes. Orientation of (A)SERPINA1 labelled green and NUDC2 in red on chromosome 1; (B)RUNX2 in red and MRPS10 in green on chromosome 2 and (C)CORTBP2 in green and p100 in red on chromosome 3. Chromosomes have been counterstained with DAPI. Scale bar represents 10 μm.