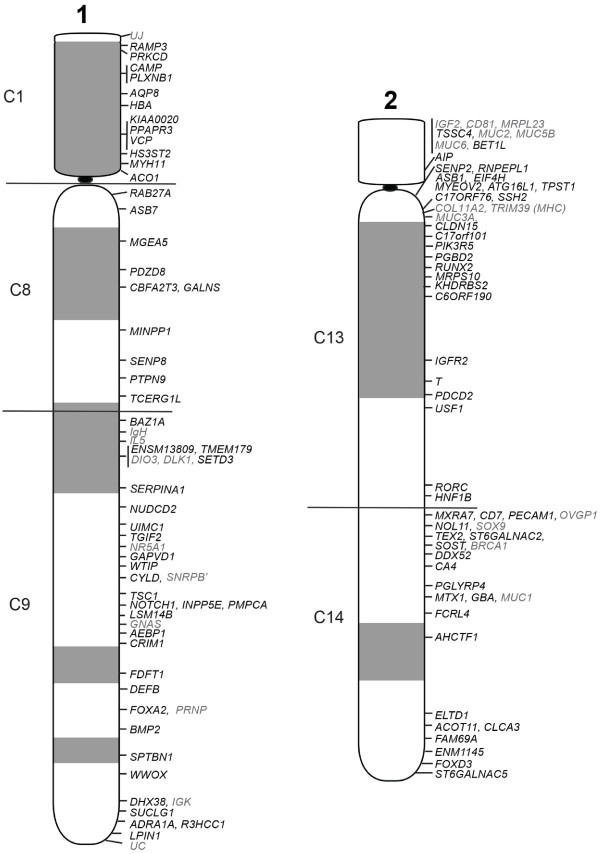
Figure 2.

Cytogenetic map of tammar wallaby chromosomes 1 and 2. The cytogenetic location of each gene mapped by FISH is indicated alongside the DAPI-banded ideograms. Gene names indicated in grey were mapped as part of previous studies. The boundaries of the conserved segments determined by chromosome painting are indicated by horizontal lines.
