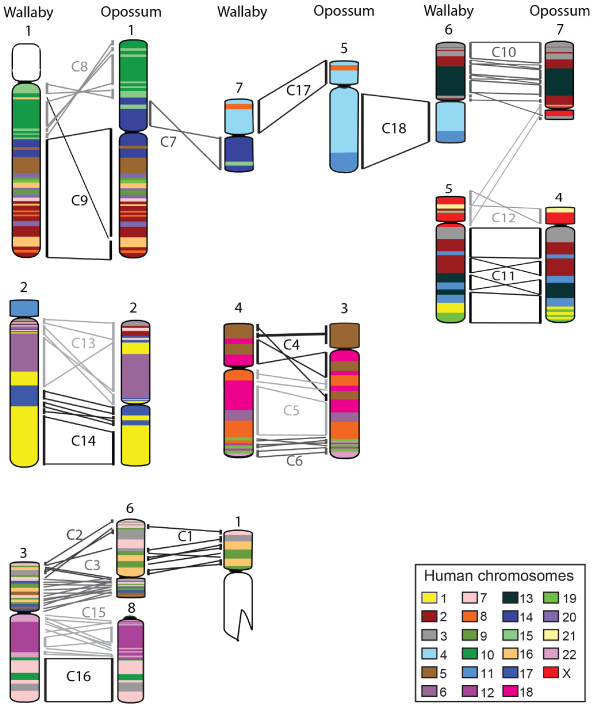
Figure 6.

Comparative maps of wallaby and opossum chromosomes. Conserved gene blocks are indicated by bars alongside chromosomes and their orientation shown by lines linking bars from the two species. The conserved segment identified from chromosome painting [6] to which each gene block belongs is indicated. Wallaby and opossum chromosomes have been colour-coded to reflect homology with human chromosomes.
