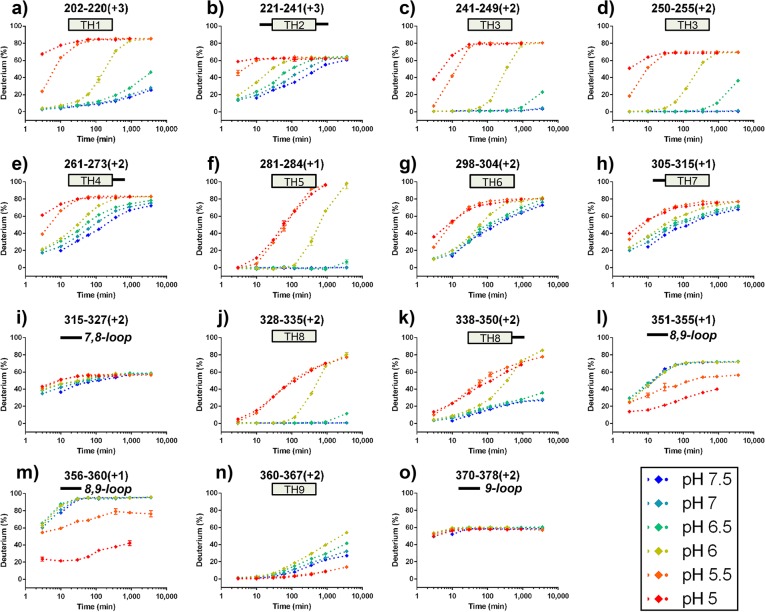
Figure 2.
HDX kinetic curves of peptides HDX under all pH conditions. HDX kinetic curves show three characteristic patterns: (1) Low D% at pH ≥ 6.5, high D% at pH ≤ 5.5, and intermediate D% at pH 6, (a–h, j–k); (2) no differences for all pH conditions, (i,o); (3) increase in D% when increasing pH to 6.5, protection in HDX at pH ≤ 5.5, (l–n). All time points were corrected to standard condition at pH 7.5 and 4 °C. Secondary features were added to all kinetic curves: for example, a) TH1 represents helix1 in T domain; (i) solid line represents loop between helix 7 and 8.

