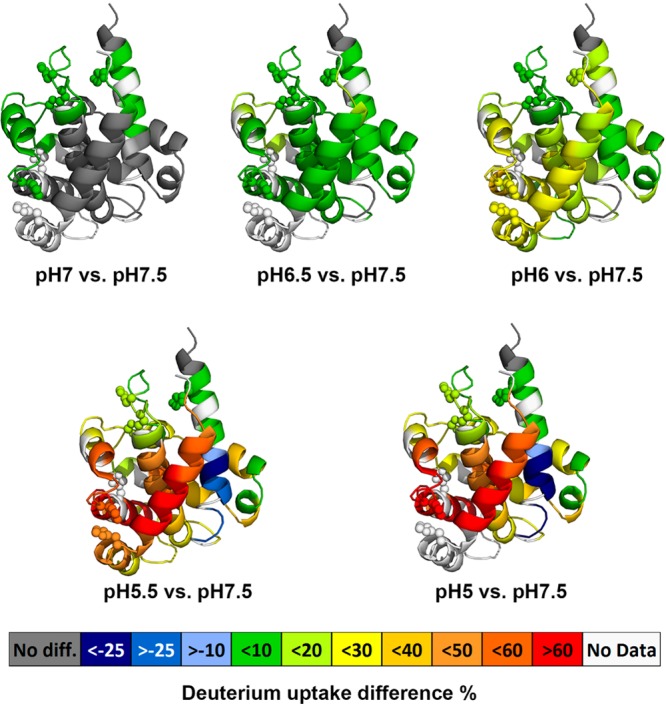
Figure 3.

Averaged deuterium uptake differences between a low pH state and standard state (pH 7.5)mapped onto crystal structure of DTT (PDB: 1MDT). The color code (see legend) represents the differential HDX between a low pH condition and the standard pH condition; the regions in the crystal structure colored in white are not detected by HDX. Protonation of histidine residues (shown as spheres) is implicated in modulating pH-dependent refolding of the T-domain.
