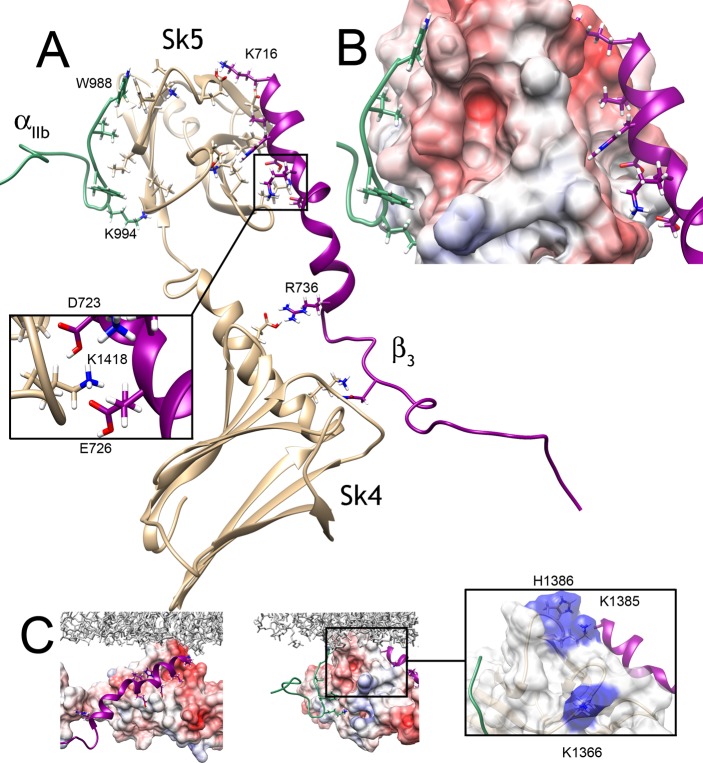
Figure 5.
(A) Model of tertiary integrin/skelemin complex: Sk45 (tan) is shown bound to cytoplasmic tails of αIIb (green) and β3 (purple) in ribbon presentation. Key residues are labeled. The inset shows a slightly rotated display of the hydrogen bonding network for a better view. (B) Zoomed view of the binding interface with Sk5 domain. The surface of Sk5 is colored based on its electrostatic potential. (C) The tertiary complex is arbitrarily placed with respect to the lipid bilayer represented by POPC and POPE mixture27 shown in gray. Each side is shown to better visualize the binding pockets and potential orientation with the lipid bilayer. The inset depicts potentially positively charged residues of Sk5 domain (colored in blue) that may interact with the lipid bilayer.

