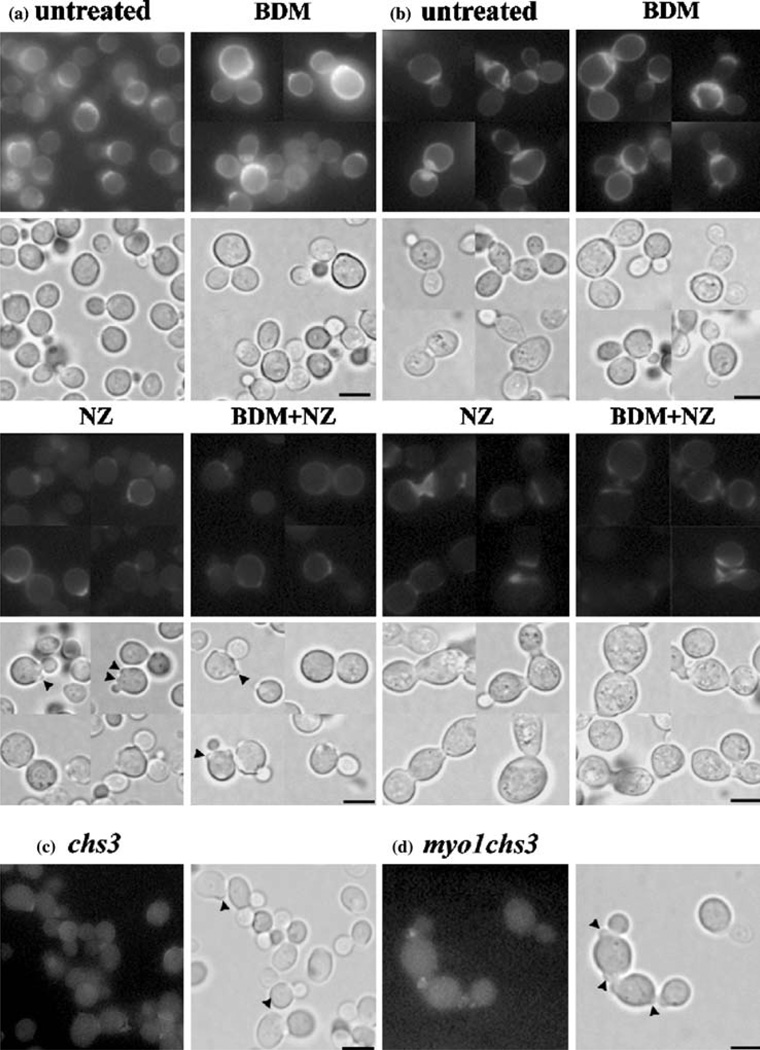
Figure 3.
Micrographic imaging of cell wall chitin distribution by Calcofluor White staining. Wild-type (a) and myo1 (b) strain cultures were treated with 2 mM BDM, 6.25 µM NZ, or treated simultaneously with 2 mM BDM and 6.25 µM NZ (BDM+NZ) for 24 h and later stained with Calcofluor White to visualize chitin deposition. Untreated control cultures of wild-type (a), myo1 (b), chs3 (c), and myo1chs3 (d) strains are shown. Upper panels represent a collage of u.v. fluorescence micrographs and the lower panels represent the corresponding light micrographs for each group. Arrowheads indicate putative aborted bud structures. All images were captured at the same exposure time and magnification (1000×). Bar=5 µm.

