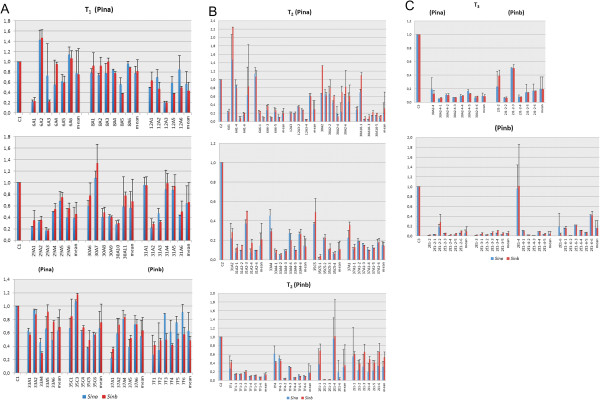
Figure 2.

Relative Sina and Sinb transcript levels measured by qRT-PCR in the 26 DAP spikes of the segregated progeny of T1 (A), T2 (B) and T3 lines (C) transformed with (Pina) or (Pinb) silencing cassettes. C1, C2, C3 – control lines from T1, T2, and T3 generations respectively transformed with the empty pMCG161 vector. The first bars of T2(B) and T3(C) represent the relative values of transcript level for parent plants of the lines. The last bars are means for the respective lines.
