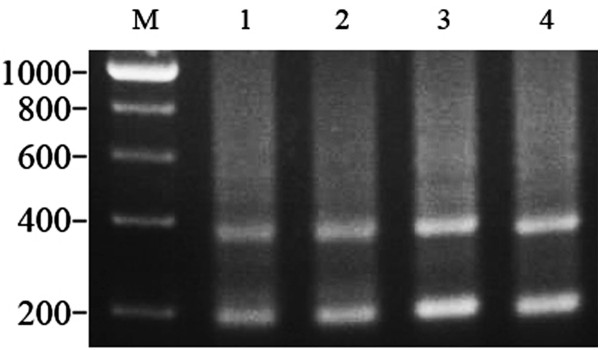
Figure 4.

DNA bands amplified from GC, BSB, and 2nGB and 3nGB hybrids. M, DNA ladder markers (200 bp increments); lane 1, two DNA bands (~200 and 400 bp respectively) from GC; lane 2, two DNA bands (~200 and 400 bp respectively) from BSB; lane 3, two DNA bands (~200 and 400 bp respectively) from 2nGB hybrids; lane 4, two DNA bands (~200 and 400 bp respectively) from 3nGB hybrids.
