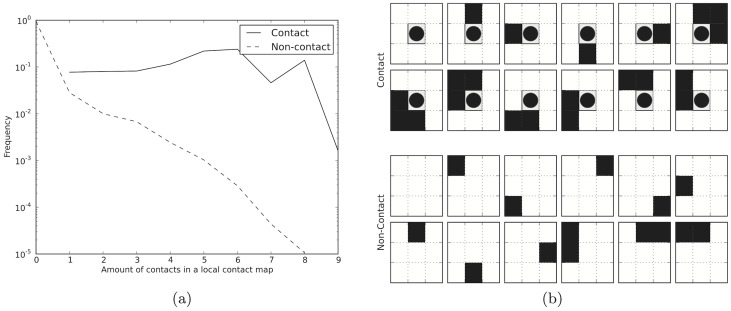
Figure 1. a) Relative frequencies of the number of contacts found in a 3×3contact map.
Solid line represents the cases where a contact is present in the central position and the dashed line where the central position is a non-contact. The X-axis shows the number of contacts within the window, while the Y-axis shows the frequency of all contact maps with this number of contacts. b) Illustration of the twelve most frequent 3×3 contact maps when the central pair is a contact (marked with a circle) or a non-contact. In both figures the data is derived from a randomly selected subset of PDB and contacts are defined as elsewhere in the paper, that is C-β-C-β distance less than 8 Å.

