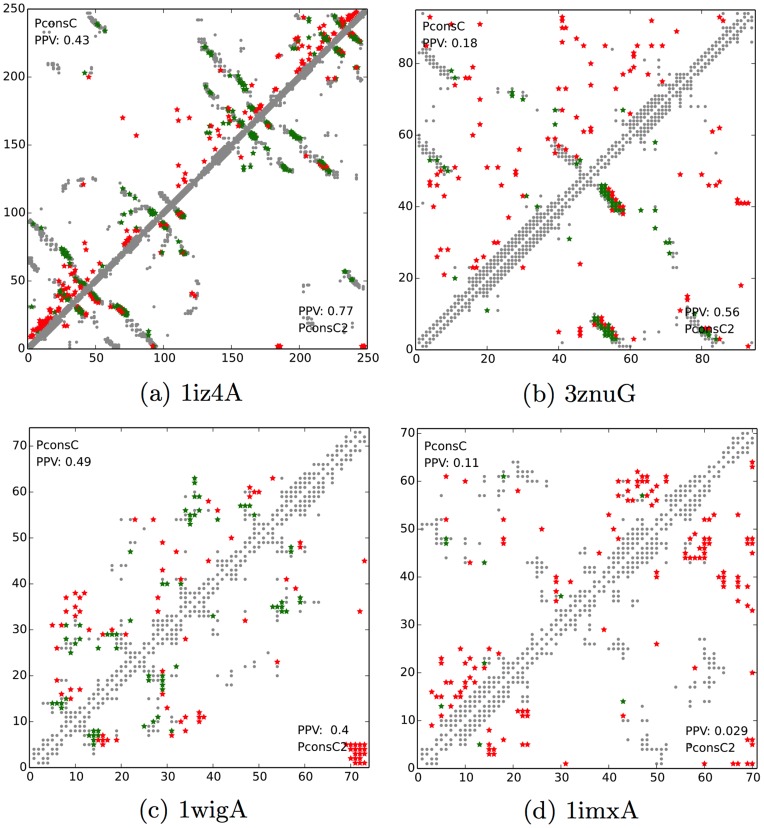
Figure 7. Contact maps for four proteins; (a) 1z4A and (b) 3znuG, (c) 1wigA and (d) 1imxA.
The upper-left triangle depicting the contact map predicted by PconsC, and lower-right triangle by PconsC2. Grey dots indicate the real, observed contacts in PDB structures, while coloured ones depict the contacts predicted by respective methods. Here red represent wrong predictions and green correct ones. The values in the corners of the contact maps represent the fraction of correctly predicted contacts within the top  long-range predictions.

