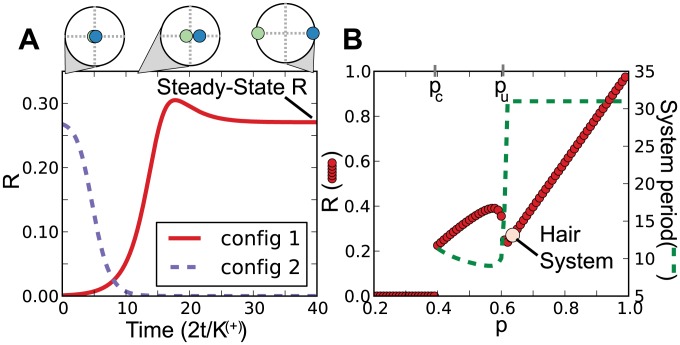
Figure 3. Simulation results from mean field coupled oscillator model.
All curves are calculated by solving EQ 2 (for additional details also see EQ 11). The magnitude of the first order parameter,  shown in red, can be easily calculated from the individual order parameters,
  and
and  . Here,
  is related to the first order parameter in Figure 2, also shown in red (note the subscript was dropped for convenience). (A) Simulation results of
  for configuration one (config 1, solid) and configuration two (confg 2 dashed). Here config 1 relates to cluster one having negative coupling (
 ). Note that the synchronization was stable only in config 1. We also show the incoherent result when configuration two (
 ) was set near, the steady-state value. The top plots show the values of
  for both cluster 1 (green) and 2 (blue) on the unit circle at time = 1, 12 and 40 days. Note that the clusters are out-of-phase. A movie of the individual oscillators corresponding to configuration 1 is available as Supplementary file S2. (B) A simulated bifurcation analysis of the model showing the stable attractors for
  at different values of
  (red dots). We note that the simulation results agree with the analytical results of
  , loss of the incoherent state, and
  , the upper bound of the wave state. The estimated period of the hair cycle is shown by the dashed line. The values corresponding to the observed hair system are highlighted, note that it is near a critical change in
  that corresponds to a sharp decrease in the period.

