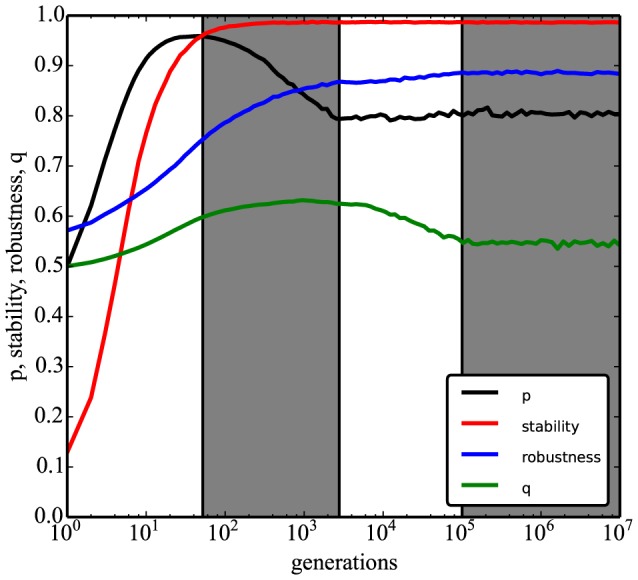
Figure 5. Positive/negative regulation evolves non-linearly with robustness.

Coevolution of stability (Equation (3)), robustness (Equation (5)), p and q (Equation (6)) under selection for stability (‘no-target’ model). Black line (p) is the same as in Figure 2A. White and grey regions serve as guides to the eye signaling different phases of evolution. From t = 1 to t∼48, p reaches its maximum and stability reaches 0.96. From t∼48 to t∼103, p approaches equilibrium and q reaches its maximum. From t∼103 to t∼105, robustness and q approach equilibrium. From t∼105 onwards, all represented quantities are at evolutionary equilibrium. Sample size is n∼105 evolved networks per generation.
