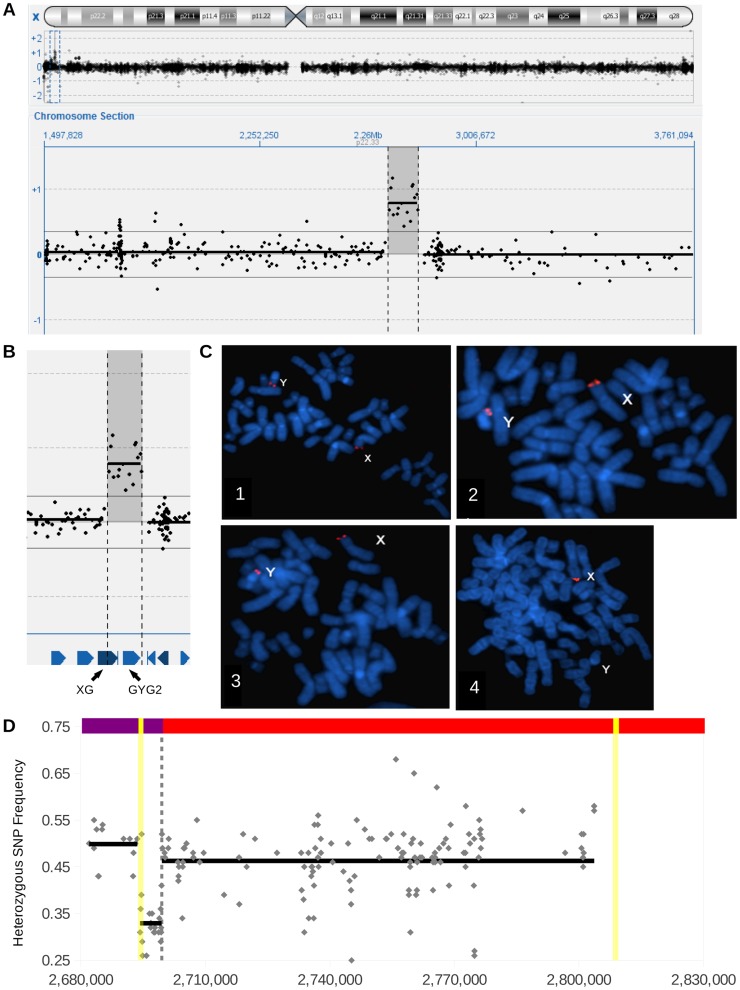
Figure 1. Identification of an X specific insertional translocation in Y.
(A) Determining a duplication by array-CGH using a 180K Custom Microarray. The upper track shows an overview of the log2-ratio of the fluorescent signal across the entire X chromosome. The central track shows a zoomed in portion of the X chromosome, with the log2-ratio of the fluorescent signals on the Y Axis. (B) Further zooming in on the duplication, including the location of genes XG and GYG2. (C) FISH results for a father carrier (1, 3) and male control (2, 4) using probes targeting PAR1 (1, 2) and the duplicated region (3, 4). Note the presence of PAR1 on X and Y chromosomes in the carrier father and control, the PAR flanking probe on the X chromosome in both individuals, but the X insertion signal is found only on the Y chromosome of the carrier father. (D) The heterozygous SNP profile from Illumina sequencing of patient P1 for hg19 chrX:2,680,000-2,830,000. The dashed vertical gray line indicates the pseudoautosomal boundary, the yellow vertical lines illustrate LTR6B positions, gray diamonds illustrate heterozygote SNPs, and the black horizontal lines indicate mean frequencies of all depicted SNPs in the span of the line. Across the top is illustrated chromosome X, with unique X sequence in red, PAR1 reference sequence in purple, and LTR6B's in yellow. Note the presence of heterozygote SNPs in the X specific region, and the SNPs featuring frequencies of 0.33 in the proximal PAR1.

