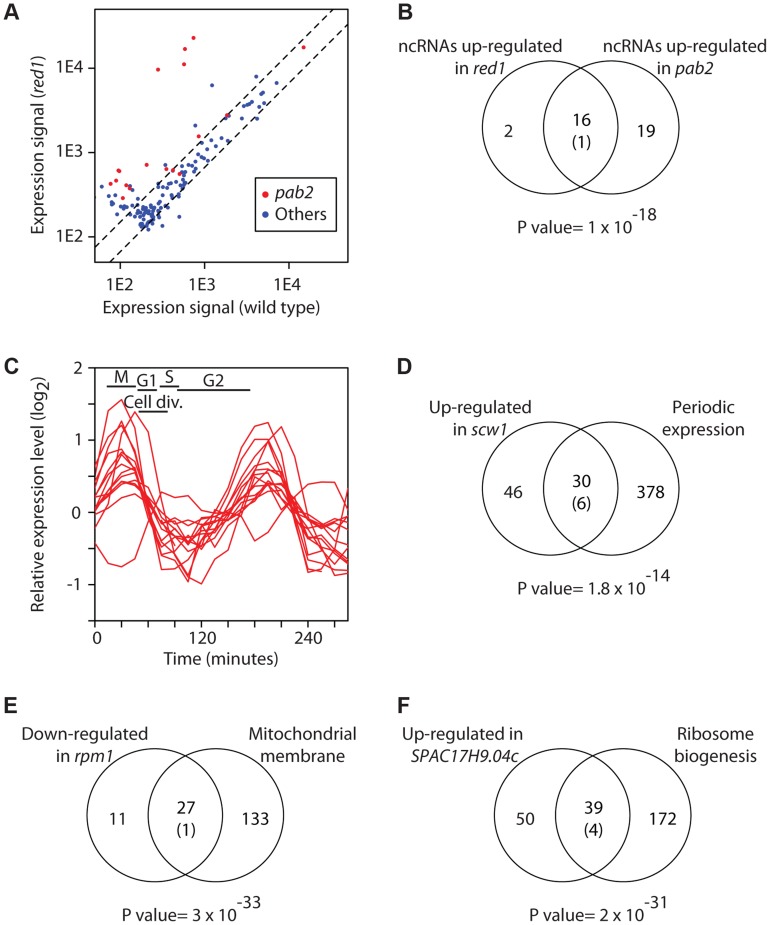
Figure 2. Characterization of the RNA sets regulated by RBPs.
(A) Inactivation of pab2 and red1 causes overexpression of a subset of ncRNAs. The y and x axes show expression levels in red1 mutants and wild type cells, respectively. Each dot corresponds to a different ncRNA. ncRNAs that are overexpressed in pab2Δ cells are displayed in red and all other ncRNAs in blue. (B) Similar sets of ncRNAs are affected in pab2 and red1 mutants. The Venn diagram shows the overlap among the ncRNAs overexpressed in red1Δ and pab2Δ cells. The number in brackets corresponds to the expected overlap if randomly-generated lists of the corresponding sizes were used. The p value of the observed overlap is shown below the Venn diagram. (C) Scw1 potential targets are enriched in cell cycle-regulated genes. Cell cycle expression profiles of periodically expressed Scw1-regulated genes (data from [76]). The timing of the cell cycle phases is shown: M (mitosis), G1, S phase (S), and G2. Cell division takes place during G1 and S phase. (D) Overlap between cell-cycle regulated genes and Scw1-regulated mRNAs. Labelling as in B. (E) Comparison of genes down-regulated in rpm1 mutants and genes encoding proteins localized to the mitochondrial membrane. Labelling as in B. (F) Overlap between genes overexpressed in SPAC17H9.04c mutants and genes encoding proteins involved in ribosome biogenesis. Labelling as in B.

