FIGURE 1.

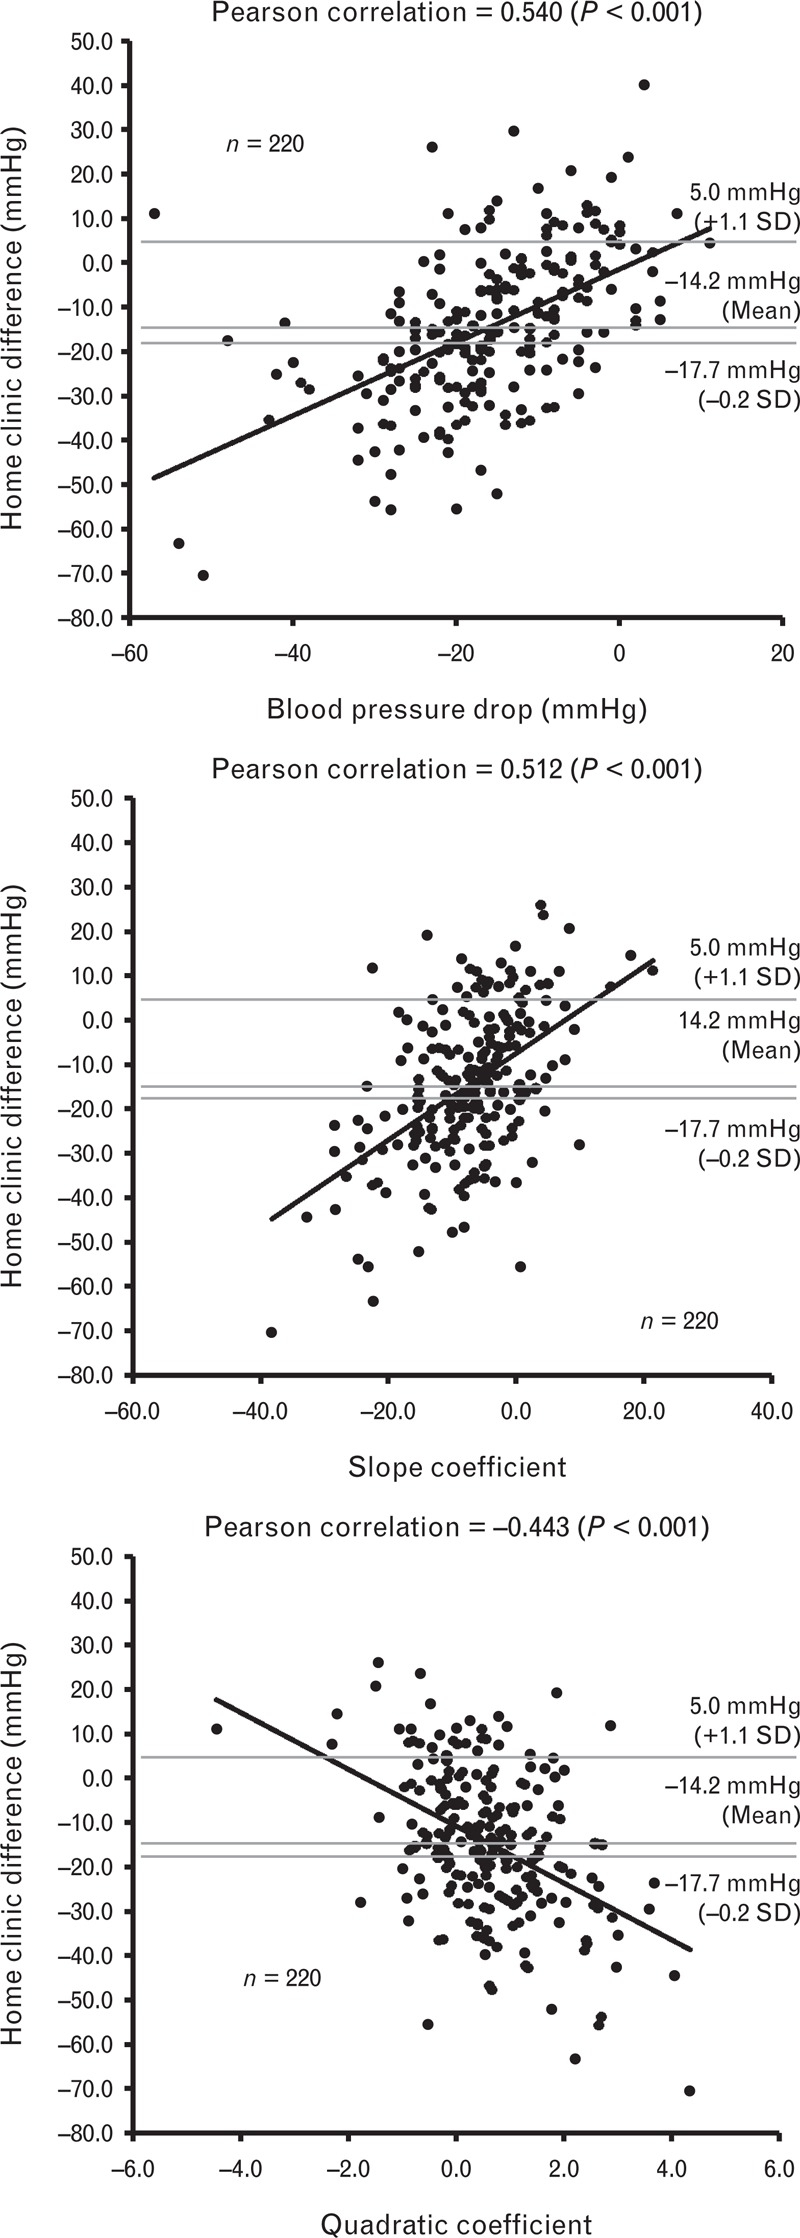
Scatter plots showing the correlation between home–clinic SBP difference and the blood pressure drop, slope and quadratic coefficients of SBP measurements in the clinic.

Scatter plots showing the correlation between home–clinic SBP difference and the blood pressure drop, slope and quadratic coefficients of SBP measurements in the clinic.