Figure 2.

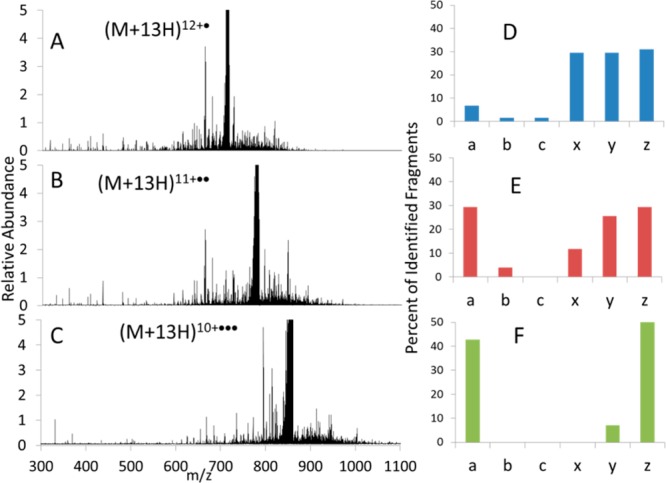
ETUVPD (8 ms ETD of ubiquitin (13+) in the LIT followed by one 1 mJ laser pulse in the HCD cell): (A) 12+·, (B) 11+··, (C) 10+···, and corresponding distribution of ion types in panels D, E, and F. All spectra are shown on the same scale.

ETUVPD (8 ms ETD of ubiquitin (13+) in the LIT followed by one 1 mJ laser pulse in the HCD cell): (A) 12+·, (B) 11+··, (C) 10+···, and corresponding distribution of ion types in panels D, E, and F. All spectra are shown on the same scale.