Figure 6.

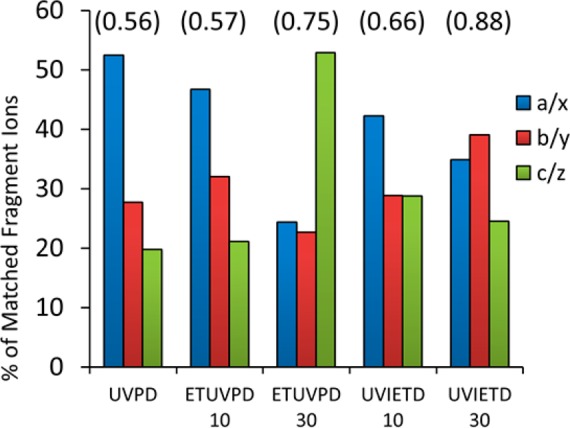
Histogram showing the distribution of ion types using UVPD and the hybrid methods for a ribosomal protein mixture. Shown above each set of bars in parentheses is the E value contribution per fragment ion.

Histogram showing the distribution of ion types using UVPD and the hybrid methods for a ribosomal protein mixture. Shown above each set of bars in parentheses is the E value contribution per fragment ion.