
Figure 2.
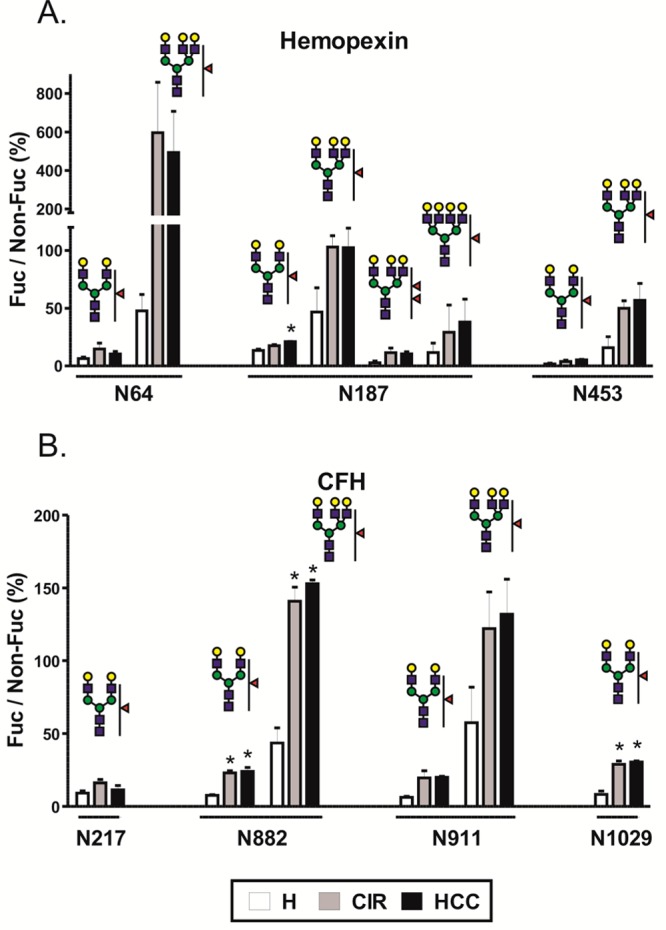
Fucosylation of desialylated glycopetides in pooled samples of healthy controls (H), cirrhosis (CIR), and HCC patients. Relative abundance of each fucosylated glycoform, quantified as area of precursor ion XIC peak, is presented as a percent of its nonfucosylated counterpart. (A) Hemopexin; (B) CFH. Glycan structures are indicated above each group of corresponding bars representing three patient groups; the position of the glycosylation site in the protein sequence is shown below. Results are shown as mean ± SD; ∗, P < 0.05 vs H.