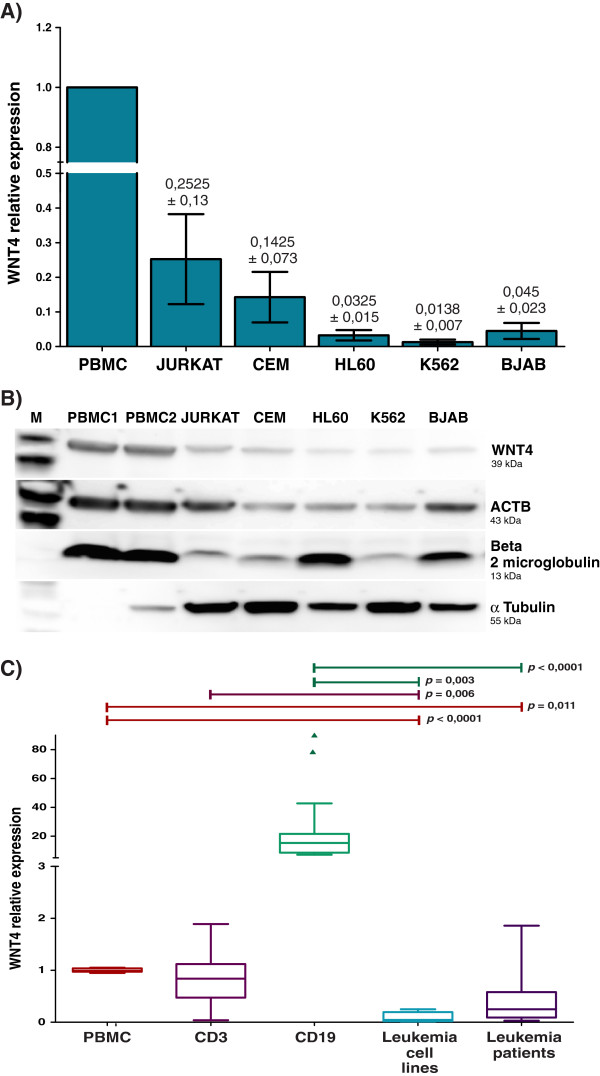
Figure 1.

WNT4 expression in healthy and leukemia-derived cells. A) Relative expression levels of WNT4 were measured by qRT-PCR in PBMCs obtained from healthy volunteers (PBMC) and leukemia-derived cells lines (Jurkat, CEM, HL60, K562, and BJAB). An expression value of the PBMCs of one individual was set as 1. Analysis was calculated using ribosomal Protein L32 (RPL32), ribosomal Protein S18 (RPS18), and beta actin (ACTB) as reference genes. The graphic depicts the means and subsequent standard deviations (SD) obtained with all reference genes. B) Western blot assay showing the presence of WNT4 protein in PBMCs from two healthy individuals and leukemia-derived cells lines. ACTB, beta 2 microglobulin, and α tubulin were used as protein loading controls. C) Box plot graphic showing relative expression levels of WNT4 measured by qRT-PCR normalized to the previously mentioned reference genes. The graph displays median (dark lines), 25–75th percentile (boxes), interquartile ranges (whiskers), and outliers (small, dark circles) from the CD3+ and CD19+ sorted cells of five healthy individuals, cell lines (Jurkat, CEM, HL60, K562, and BJAB), and 11 patients with leukemia. Average values from the PBMCs obtained from the five healthy volunteers were used as controls. Statistical significances are shown between both groups. Experiments were carried out at least twice.
