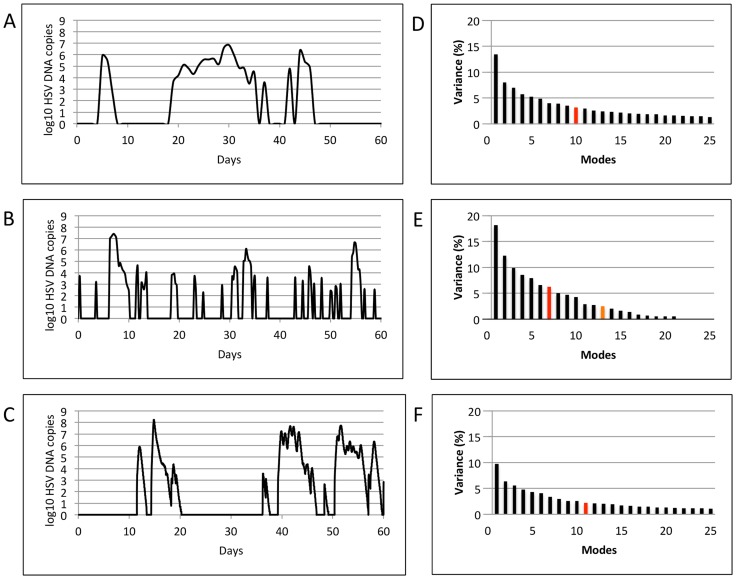
Figure 1. Results of Singular Value Decomposition on longitudinal data that captured multiple diverse episodes.
Left column shows representative shedding curves from single patients: (a) Clinical data (swabs every 24 hours for 60 days), (b) Clinical data (swabs every 6 hours for 60 days), and (c) Modeled data (swabs every 15 minutes for 60 days). Right column (d,e,f) shows plots of singular values for the corresponding datasets (100, 25 and 98 patients, respectively). For all the three datasets, the most dominant features accounted for a very small percentage (13.5, 18.2, and 9.7 respectively) of the total variance of the system, and were closely followed by other features with gradually declining variances, making dimensional reduction infeasible. Red and orange bars indicate number of modes at which a total of 50% and 90% variance is achieved.

