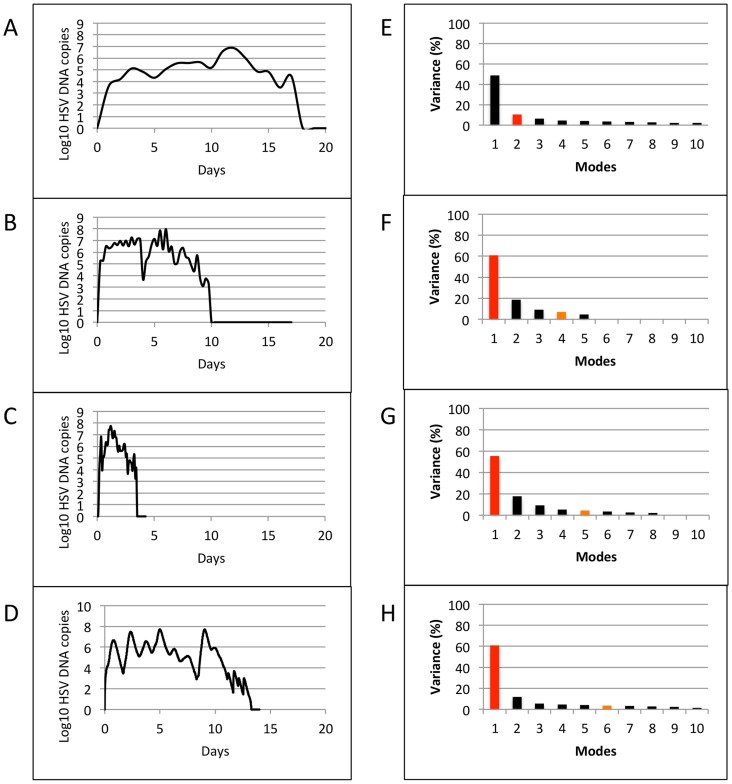
Figure 3. Results of Singular Value Decomposition on sets of individual non-monotonically decaying episodes.
Left column shows representative curves from single patients: (a) Clinical data (23 episodes, swabs every 24 hours) (b) Clinical data (5 episodes, swabs every 6 hours), (c) Clinical data (8 episodes, 10 swabs/day: every 2 hours during the day and 4 hours overnight), and (d) Modeled data (10 episodes, 100 swabs/day). Right column (e–h) shows plots of singular values for the corresponding datasets. Red and orange bars indicate number of modes at which a total of 50% and 90% variance is achieved.

