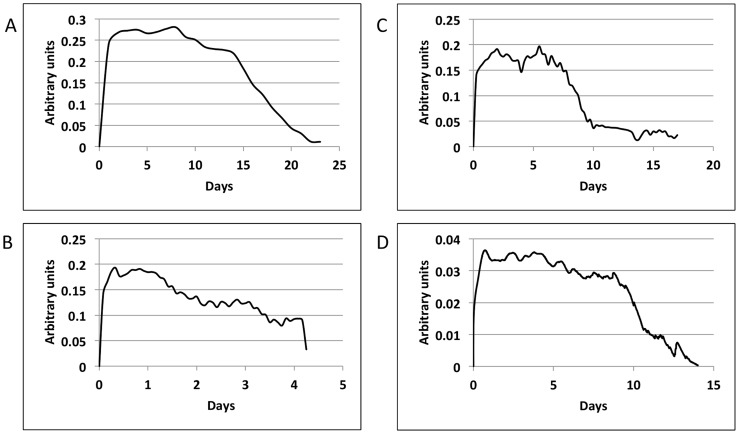
Figure 5. Most dominant feature of single representative non-monotonically decaying episodes.
(a) Clinical data (swabs every 24 hours), (b) Clinical data (swabs every 6 hours), (c) Clinical data (10 swabs/day: every 2 hours during the day and 4 hours overnight), and (d) Modeled data (swabs every 15 minutes). The arbitrary unit is used to demonstrate relative amount of virus. All tracings demonstrate viral expansion, plateau and clearance phases.

