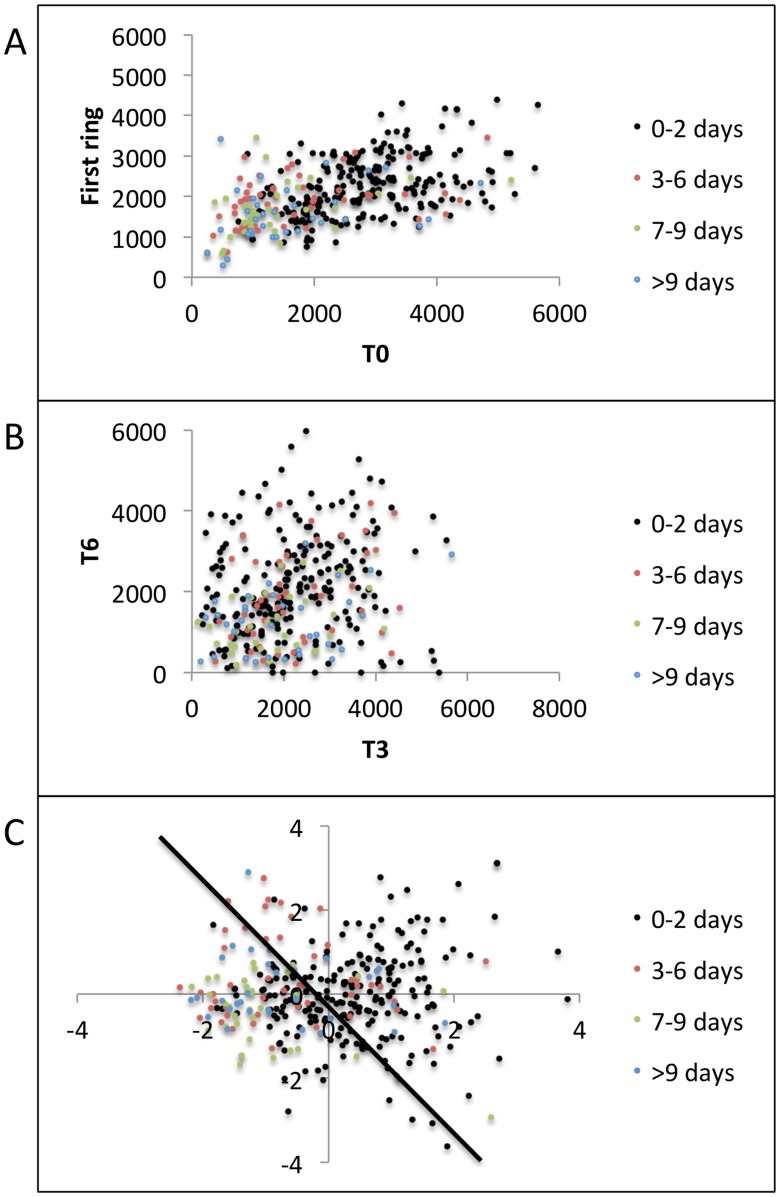
Figure 7. Grouped scatter plots.
(a) T-cell density in region of episode initiation (T0) versus mean of the first ring of T-cell densities ((T1+T2+…+T6)/6). Class A (0–2 days) was characterized by higher T-cell densities than Classes B (3–6 days), C (7–9 days), and D (> = 10 days). Class A features were well separated in a cluster while Classes B, C, and D had overlapping feature clusters, (b) 2 randomly selected regions from the first ring reveal less separation among the 4 classes. (c) First 2 canonical features C1 and C2 obtained by projecting original features <T1; T2; T3; T4; T5; T6> onto the eigen vector given by MATLAB's manova1 routine to maximize separation between classes. Black line shows a possible decision boundary with Class A features mostly clustering on its right side, while Classes B, C, and D showing significant overlap on the left side.

