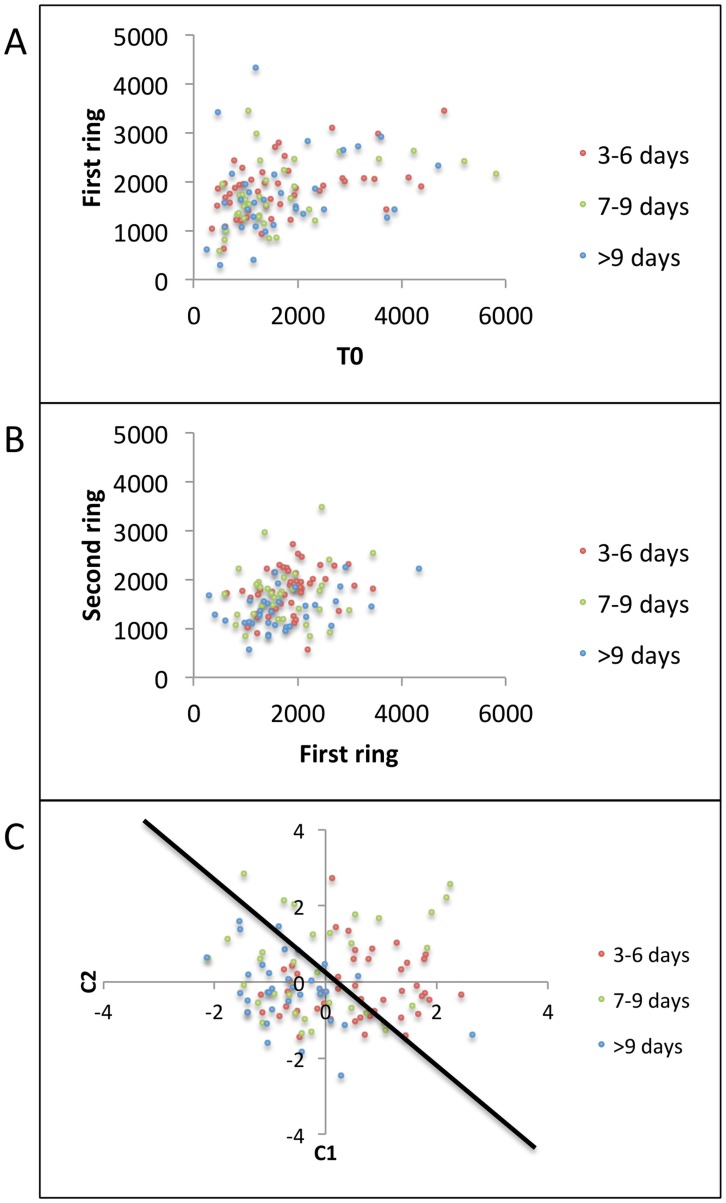
Figure 8. Grouped scatter plots including second ring (T7, T8,…., T18) of T-cell densities for classifying Classes B (3–6 days), C (7–9 days), and D (> = 10 days).
(a) T-cell density in region of episode initiation (T0) versus mean of the first ring of T-cell densities ((T1+T2+…+T6)/6) demonstrates no separation between groups, (b) Mean of the first ring versus mean of the second ring ((T7+T8+…+T18)/12) of T-cell densities demonstrates no separation between groups. (c) First 2 canonical features C1 and C2 obtained by projecting second ring of T-cell densities onto the eigen vector given by MATLAB's manova1 routine to maximize separation between classes. Black line shows a possible decision boundary with Class D features clustering on its left side, while Classes B, and C show significant overlap on both sides.

