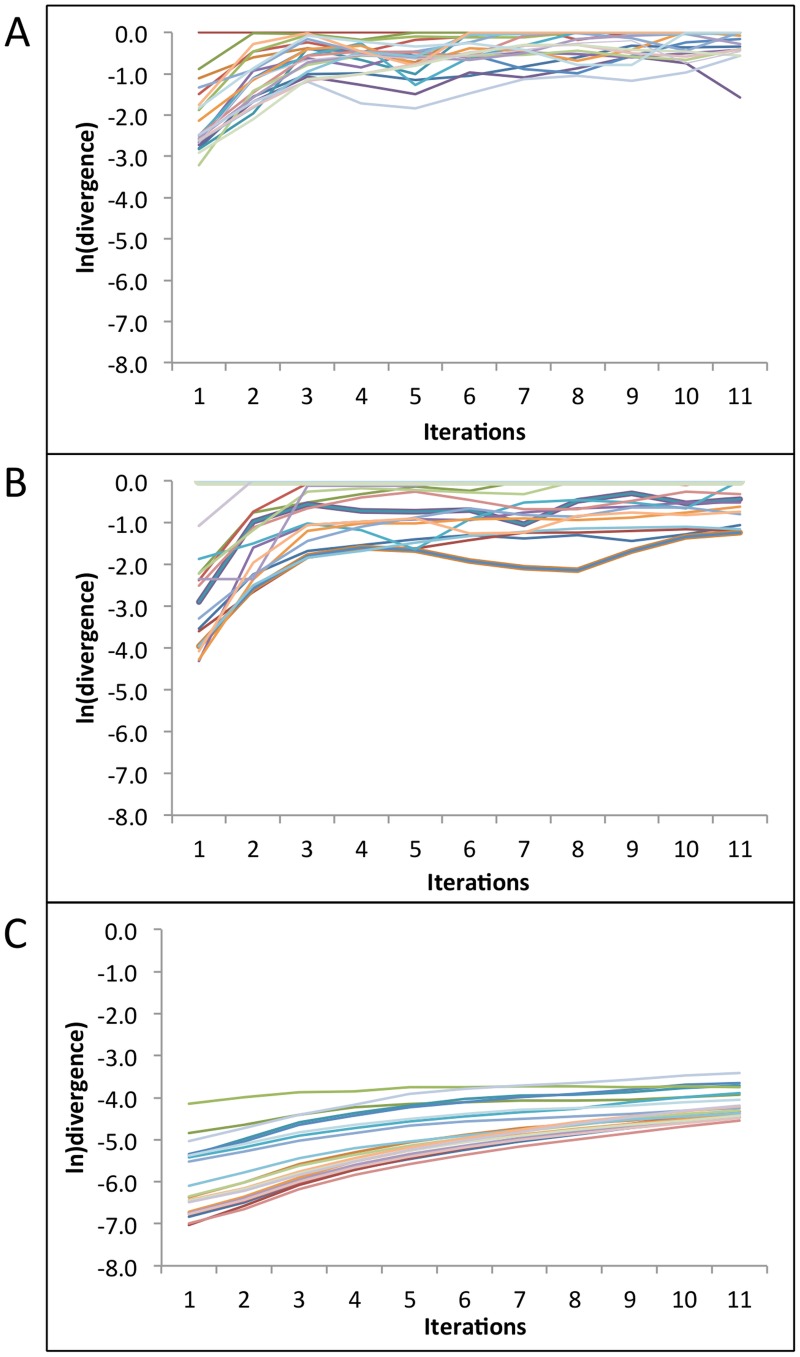
Figure 9. Rate of divergence of neighboring trajectories for each time series sample in (A) Clinical data (100 samples, every 24 hour swabs for 60 days), (B) Clinical data (25 samples, every 6 hour swabs for 60 days), and (C) Model simulation data (98 simulated samples, 100 swabs/day).
A more prominent linear region of the curve indicates a more reliable LLE computation.

