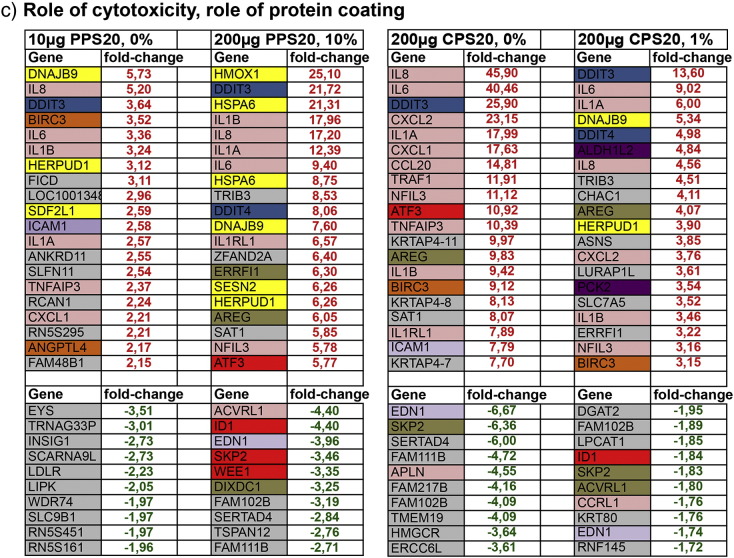
Fig. 3.
List of the 20 top up-regulated genes (fold-change in red) and the 10 top down-regulated genes (fold-change in green). Out of all whole genome expression analyses datasets to study the role of size (a), cytotoxicity; particle concentration (b), and cytotoxicity/role of protein coating (c) are listed. Genes are categorized according to GeneCards® to their localization or biological function. Headings of the columns indicate exposure conditions: particle concentration and % of FBS in DMEM.


