
Figure 2. Number of reported dengue disease cases and dengue disease incidence, Thailand, 2000–2011 [23]–[34].
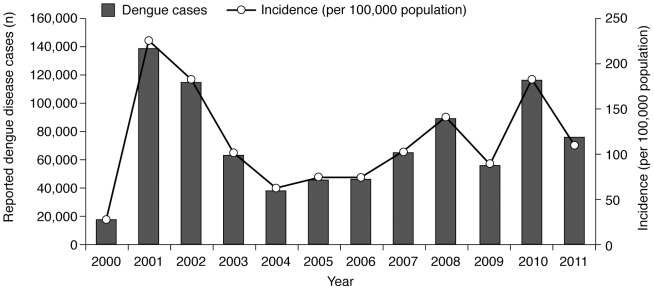
The number of reported dengue disease cases is plotted against the left-hand vertical axis. Peaks in the number of cases (national epidemics) that were above the 75th percentile for the period occurred in 2001, 2002 and 2010; another peak (which was at the 70th percentile) occurred in 2008. The incidence of dengue disease per 100,000 population is plotted against the right-hand vertical axis. The incidence averaged 115 cases annually between 2000 and 2011. No clear trend over time in the number or incidence of reported dengue disease cases could be discerned as the pattern over the review period was complicated by epidemic years.