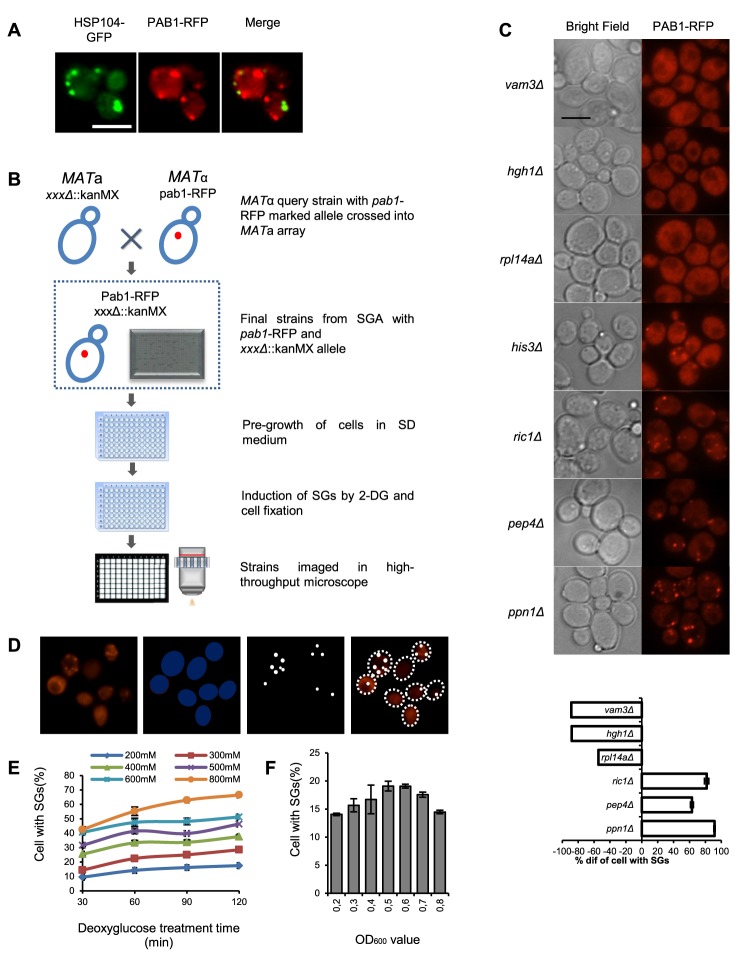
Figure 1. Workflow of genome-wide screen for SG-defective mutants.
A) Stress granules induced by 400 mM 2-DG as visualized by Pab1-RFP do not co-localize with Hsp104-GFP granules. Scale bar, 5 µm. B) Construction of haploid strain set containing gene deletions and Pab1-RFP, transfer to microtiter plates for storage, pre-growth of cells, induction of SGs by 2-DG, fixation and visualization. C) Upper panel: Micrographs of mutants displaying fewer SGs than wt (vam3Δ, hgh1Δ, rpl14aΔ); wt level (his3Δ); or more SGs than wt (ric1Δ, pep4Δ, ppn1Δ). Left column, bright field; right column, RFP fluorescence. Scale bar, 5 µm. Lower panel: Values are normalized such that the fraction of Pab1 granule-positive cells in wt cells for the stress condition in question is set to 0. A value of −100% means that there are no cells of that mutant with SGs; a value of −50% means that the fraction of SG-positive cells in that mutant is half of the fraction in the wt under the same conditions; a value of +100% means that the fraction is twice that in the wt. D) Identification and quantification of SGs by automated image analysis. E) Fraction of SG-positive cells as a function of 2-DG concentration. Cells were grown to A600 nm = 0.5 and SGs were recorded at the indicated times of 2-DG exposure. F) Fraction of SG-positive cells as a function of culture density. Cells were exposed to 400 mM 2-DG concentration for 30 min.

