
FIGURE 1.
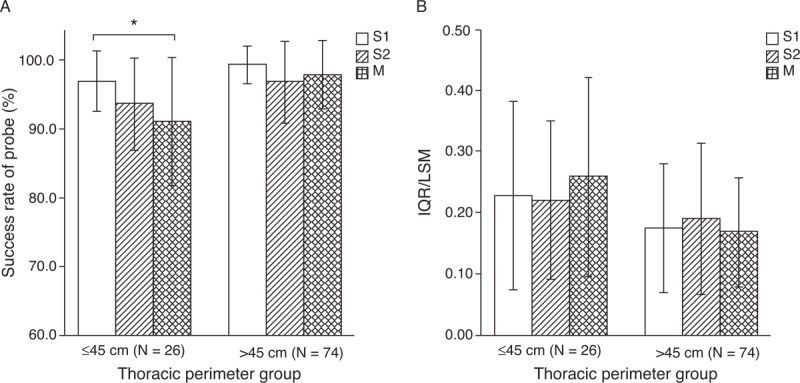
Success rates (A) and IQR/LSM ratios (B) of S1, S2, and M probes in the large thoracic perimeter group and the small thoracic perimeter group. (∗) Success rate of the S1 probe was significantly higher than that of the M probe in the small thoracic perimeter group (P = 0.0016). The IQR/LSM ratio among probes in both groups was not significantly different. Data are expressed as mean ± standard deviation. IQR = interquartile range; LSM = liver stiffness measurement.