
FIGURE 2.
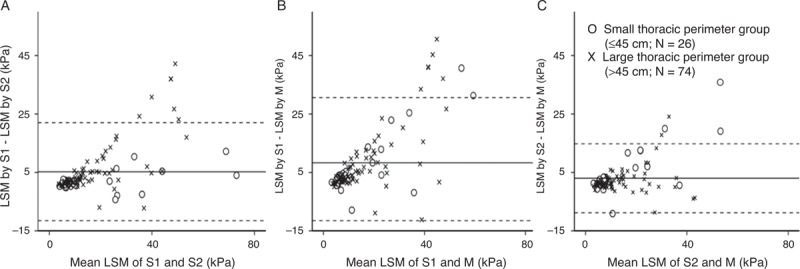
Bland-Altman plot of the difference in LSM by 2 different probes versus the mean of LSM. The solid lines indicate mean difference, and dotted lines represent 2 standard deviations between 2 probes. A, S1 and S2, 5.2 ± 16.8 kPa; (B) S1 and M, 8.3 ± 22.3 kPa; and (C) S2 and M, 3.0 ± 11.8 kPa. Outliers are noted in patients with high mean LSM. LSM = liver stiffness measurement.