
FIGURE 3.
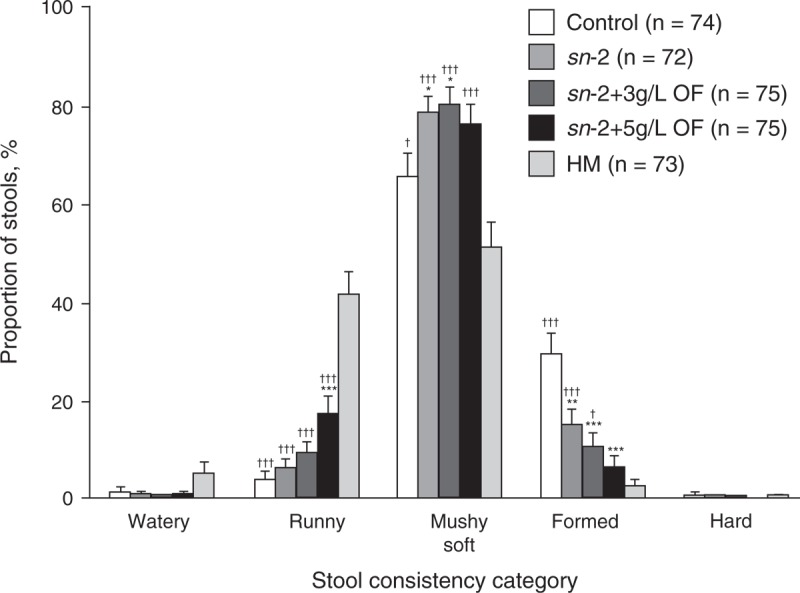
Stool consistency at week 8 for all infants according to feeding group. Analysis of variance followed by pairwise comparisons for formula groups, and independent t tests for each of the formula groups versus the HM group. Mean (±standard error) significantly different from control: ∗P < 0.05, ∗∗P < 0.01, ∗∗∗P < 0.001; significantly different from HM: †P < 0.05, ††P < 0.01, †††P < 0.001. HM = human milk; OF = oligofructose; sn-2 = high sn-2 palmitate infant formula.