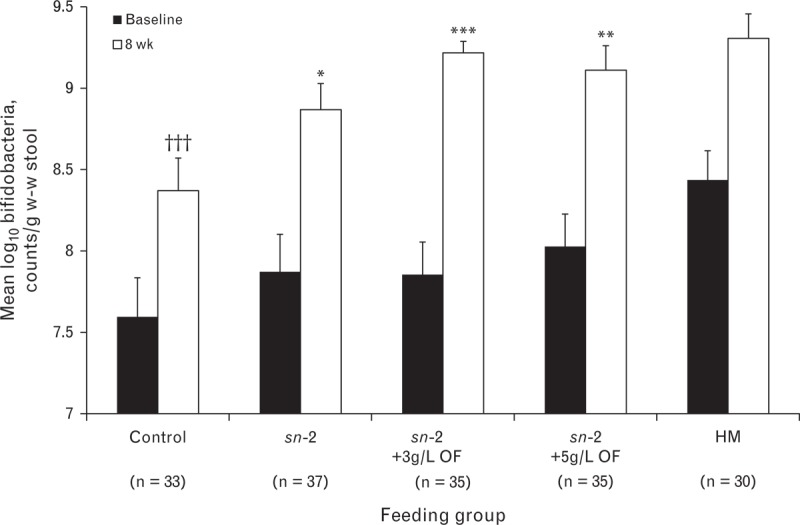
FIGURE 4.

Bifidobacteria counts in w-w stool at baseline and week 8 in a subset according to feeding group. Plotted values are unadjusted mean (±standard error). Data were analyzed using analysis of covariance with baseline values and type of delivery (vaginal vs cesarean section) included in the model, followed by pairwise comparisons for formula groups, as well as for each of the formula groups versus the HM group. LS mean log10 counts/g w-w stool (±standard error) significantly different from control: ∗P < 0.05, ∗∗P < 0.01, ∗∗∗P < 0.001; significantly different from HM: †††P < 0.001. HM = human milk; LS = least squares; OF = oligofructose; sn-2 = high sn-2 palmitate infant formula; w-w = wet weight.
