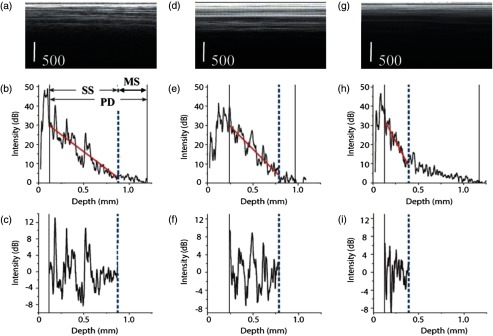
Fig. 3.

Illustration of the initial processing steps applied to three data sets corresponding to adipose (a), fibrous (d), and tumorous tissue (g) each frame has 100 A-lines. Corresponding depth profiles and linear fit are shown in (b), (e), and (h). The profile variation around the linear fit on the single scattering (SS) contribution is shown in (e). MS stands for the contribution of multiple scattering, while PD stands for the full penetration depth. The extracted AC components of the reflectivity profiles are shown in (c), (f), and (i).
