
Fig. 1.
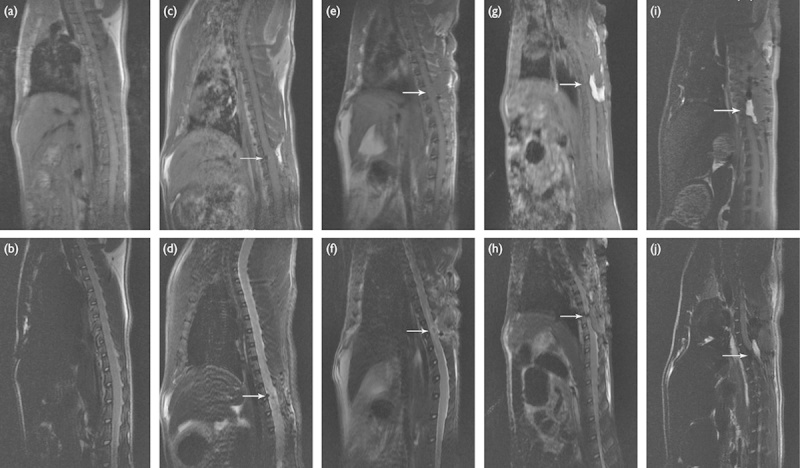
T1-weighted and T2-weighted images of the spinal cord of rats in different groups at week 1 postoperatively. (a, b) Control group; (c, d) hemisection group; (e, f) contusion group; (g, h) transection group; (i, j) segment resection group. The arrow indicates the injured site.