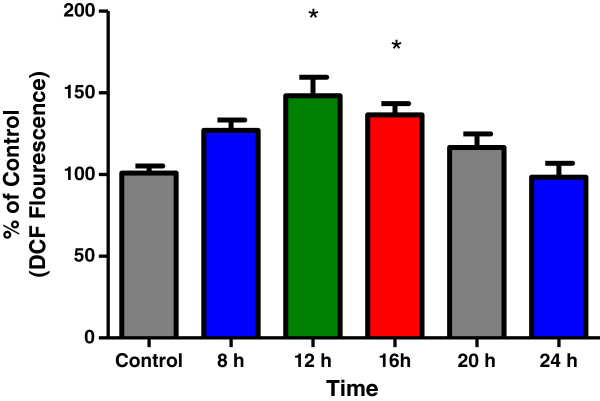
Figure 3.

Time-course effect of EEGE on ROS generation in EAT cells. The fluorescence intensity of DCF was monitored at 538 nm, with excitation wavelength set at 490 nm, and used to indicate the level of intracellular peroxides formation. Changes in DCF fluorescence in tumor cells were measured at 8, 12, 16, 20 and 24 hours after treatment with 50 μg/ml of EEGE, *p < 0.01 compared to control and 24 h-time points (ANOVA, Tukey test). The results express the mean ± S.D. of three independent experiments run in duplicate.
