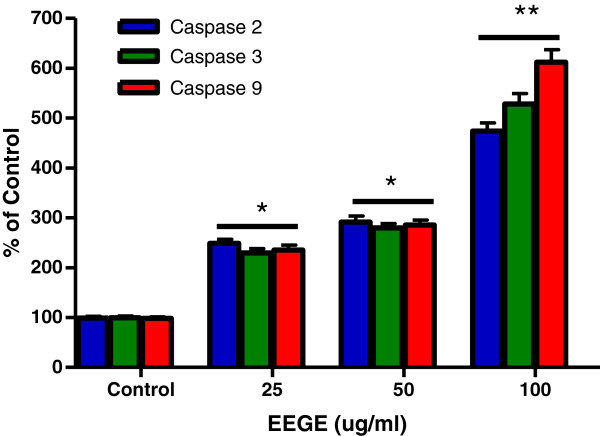
Figure 7.

Alterations on caspase-2, caspase-3 and caspase-9 activities after incubation of EAT cells (3 × 10⁵ cells/ml) with different concentrations of EEGE for 72 hours, *p < 0.05 compared to control cells. **p < 0.01 compared to control cells and to 25 and 50 μg/ml treatment (ANOVA, Tukey test). The results express the mean ± S.D. of two experiments run in triplicate.
