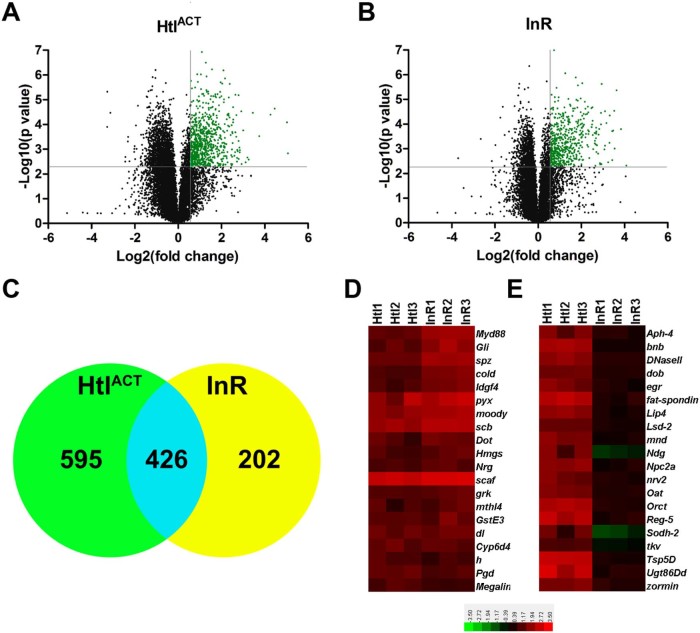
Fig. 2.
Glial enriched larval CNS gene expression profiles. (A,B) Volcano plots of transcript expression levels from larval CNS tissue overexpressing HtlACT (A), or the InR (B) in glia using repo-Gal4. Transcripts whose expression increased ≥1.5 fold with a p value ≤0.05 are shown in green. (C) Venn diagram showing the numbers of genes whose expression was significantly increased ≥1.5 fold in either HtlACT overexpressing CNS tissue (green circle), InR overexpressing CNS tissue (yellow circle), or in both conditions (blue overlap). (D,E) Heat maps representing expression levels (log2) of 20 genes whose expression was similar (D), or significantly different (E) in HtlACT (Htl1-3) and InR (InR1-3) overexpressing CNS tissue.

