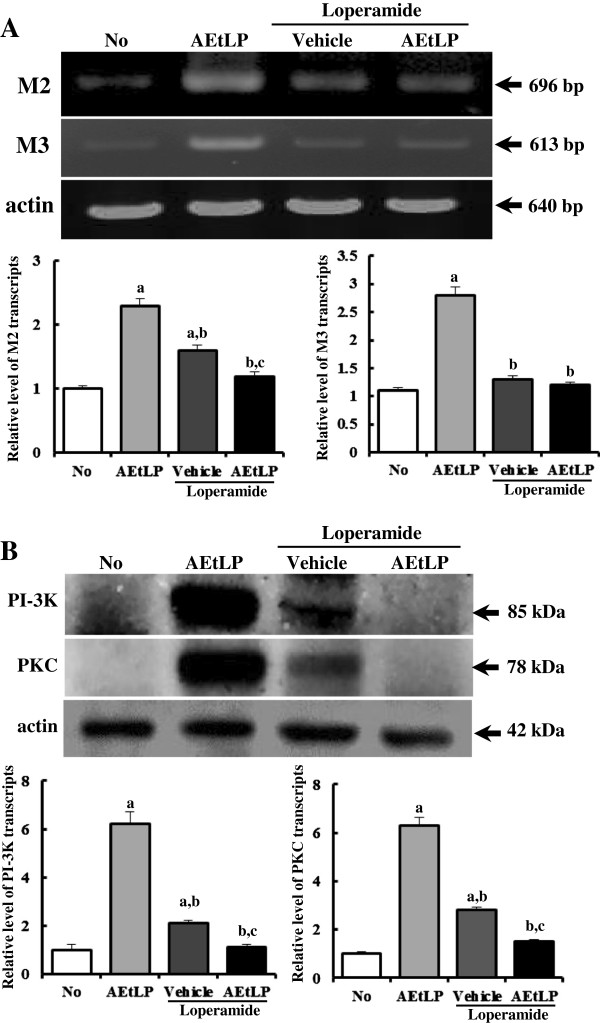
Figure 4.

Level of mAChR and their downstream signal. Alteration of the level of mAChR M2 and M3 transcripts was measured by RT-PCR (A), while PI-3 K and PKC level was determined using Western blot (B). The level of mAChR M2 and M3 transcripts in transverse colons was measured by RT-PCR using specific primers. After the intensity of each band was determined using an imaging densitometer, the relative levels of PI-3 K and PKC protein were calculated based on the intensity of actin protein. Five to six rats per group were assayed in triplicate by RT-PCR and Western blotting assays. Data represent the mean ± SD of three replicates. a, p < 0.05 compared to the No-treated group. b, p < 0.05 compared to the AEtLP-treated group. c, p < 0.05 compared to the Lop + vehicle-treated group.
