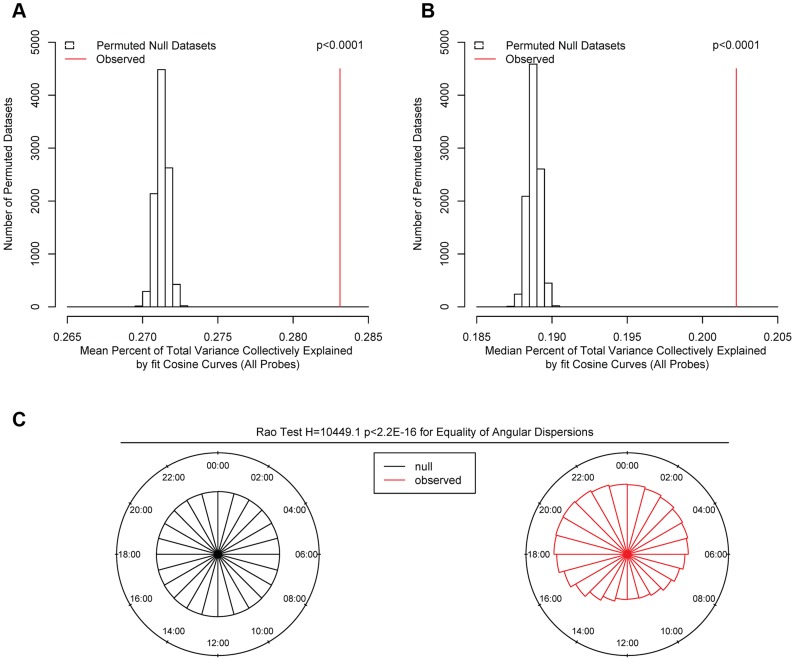
Figure 2. Comparison of observed and permuted null datasets.
(A) Mean and (B) Median proportion of methylation variance collectively explained by cosine curves in the 10000 permuted null (open bars) and the observed (red line) datasets, considering all 420,132 sites. In none of the permuted datasets did the mean or median percentage of variance explained exceed that in the observed data, indicating that the probability of the observed data having occurred by chance alone is p<0.0001. (C) Comparison of the timing of the nadirs of methylation at all 420,132 sites in the null (black) and the observed (red) datasets. The nadir times are uniformly distributed in the null datasets. In contrast, the nadir times are significantly non-randomly clustered in the observed data (H2 = 10449.1; p<2.2×10⁻¹⁶ by the Rao test for equality of dispersions).

