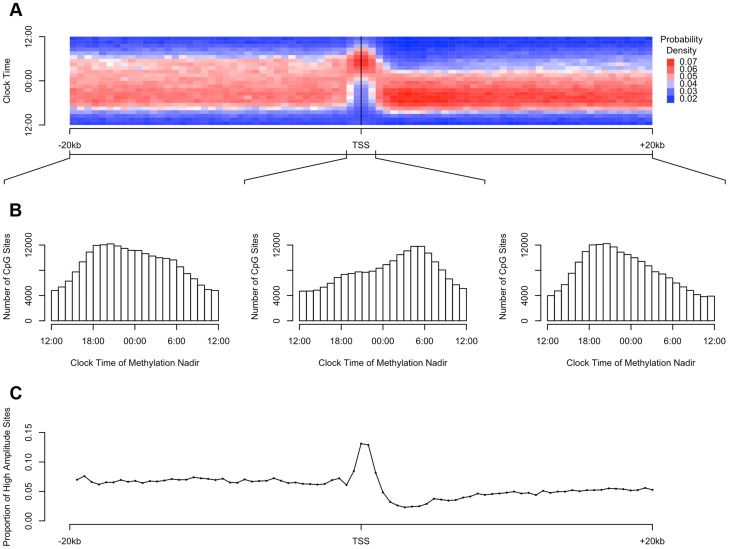
Figure 3. The timing and amplitude of DNA methylation at sites near transcription start sites is distinct from other DNA methylation sites.
(A) Heat map of the distribution of methylation nadir times as a function of distance from the transcription start site, considering all DNA methylation sites, in 500 bp bins. Each row depicts a one-hour bin of clock time. Red indicates a greater than expected density of methylation nadir times; blue indicates a less than expected density of methylation nadir times. (B) The same data depicted as histograms stratified into three groups: sites between −20 kb and −1 kb relative to the nearest transcription start site, sites between −1 kb and +1 kb of the nearest transcription start site, and sites between +1 kb and +20 kb of the nearest transcription start site. DNA methylation sites near transcription start sites have a tendency to reach their methylation nadir in the early morning, peaking at 5:30, while sites elsewhere are most apt to reach their methylation nadir in the evening, peaking at 20:30 (H1 = 7136.9; p<2.2×10⁻¹⁶ by the Rao test for equality of polar direction). (C) The proportion of all DNA methylation sites that have a peak to trough difference of more than 10% of the mean methylation level in 500 bp bins relative to the nearest transcription start site. High-amplitude rhythmic DNA methylation sites are enriched in the 1000 kb around transcription start sites (χ2 64712.6, p<2.2×10⁻¹⁶).

