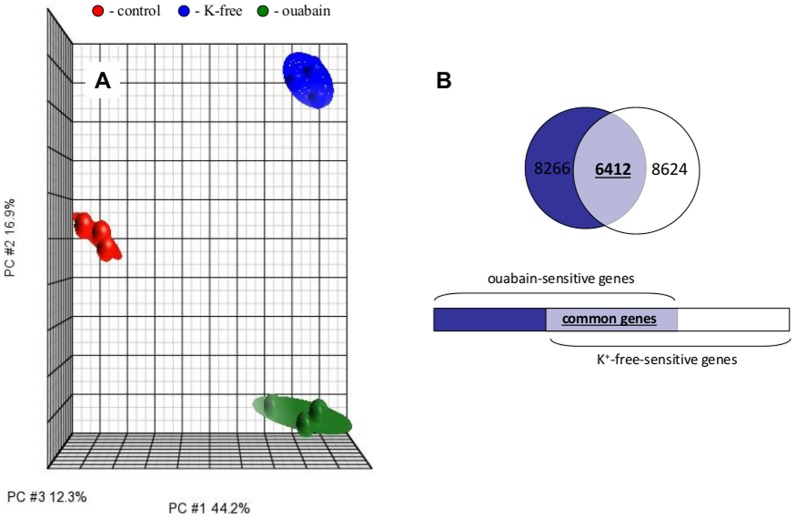
Figure 3. Effect of Na+,K+-ATPase inhibition on the RASMC transcriptome.
Cells were incubated for 6 hr in control DMEM, K+-free DMEM or DMEM containing 3 mM ouabain. All experiments are repeated 3 times. A. PCA of transcriptomic changes. Ellipsoids highlight portioning of samples based on type of treatment. The principal components in 3-dimensional graphs (PC#1, PC#2 and PC#3) represent the variability of gene expression level within datasets. B. Comparative analysis of the impact of Na+,K+-ATPase inhibition by ouabain and K+-free medium on the RASMC transcriptome. The total number of genes whose expression is altered by ouabain and K+-free medium by more than 1.2-fold with p<0.05 is indicated; the number of genes affected by both stimuli appears in bold.

