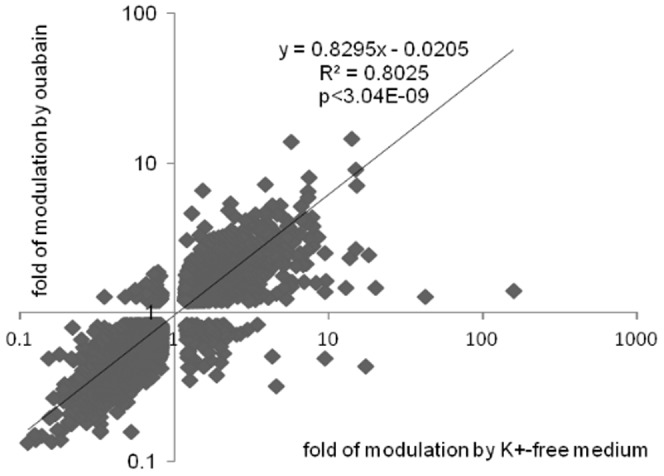
Figure 4. Correlation analysis of transcripts whose expression is altered by ouabain and K+-free medium in RVSMC by more than by 1.2-fold with p<0.05.

The total number of transcripts subjected to analysis is shown in Figure 2B. Transcript expression in control cells was taken as 1.00. The fold change was determined as log transformed treatment/control expression ratio.
