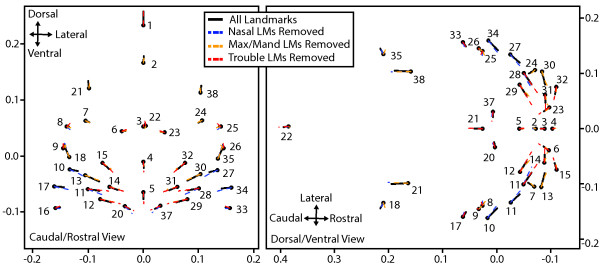
Figure 6.

Comparison of ontogenetic shape change vectors for landmark subsets. Comparison of ontogenetic shape change vectors for regressions of landmark coordinates on centroid size for all landmarks (black), when nasal landmarks (LMs) were removed (blue), maxillary/mandibular removed (orange), and trouble landmarks removed (red). The vectors are based on the regression coefficients for each axis of a given landmark and all plotted relative to the mean procrustes coordinates of that landmark calculated when including all landmarks. The values of all axes are procrustes coordinates.
